The cockpit
The cockpit is the screen you land on. It answers one question, is anything wrong right now, across every organization and project you belong to, all at once.
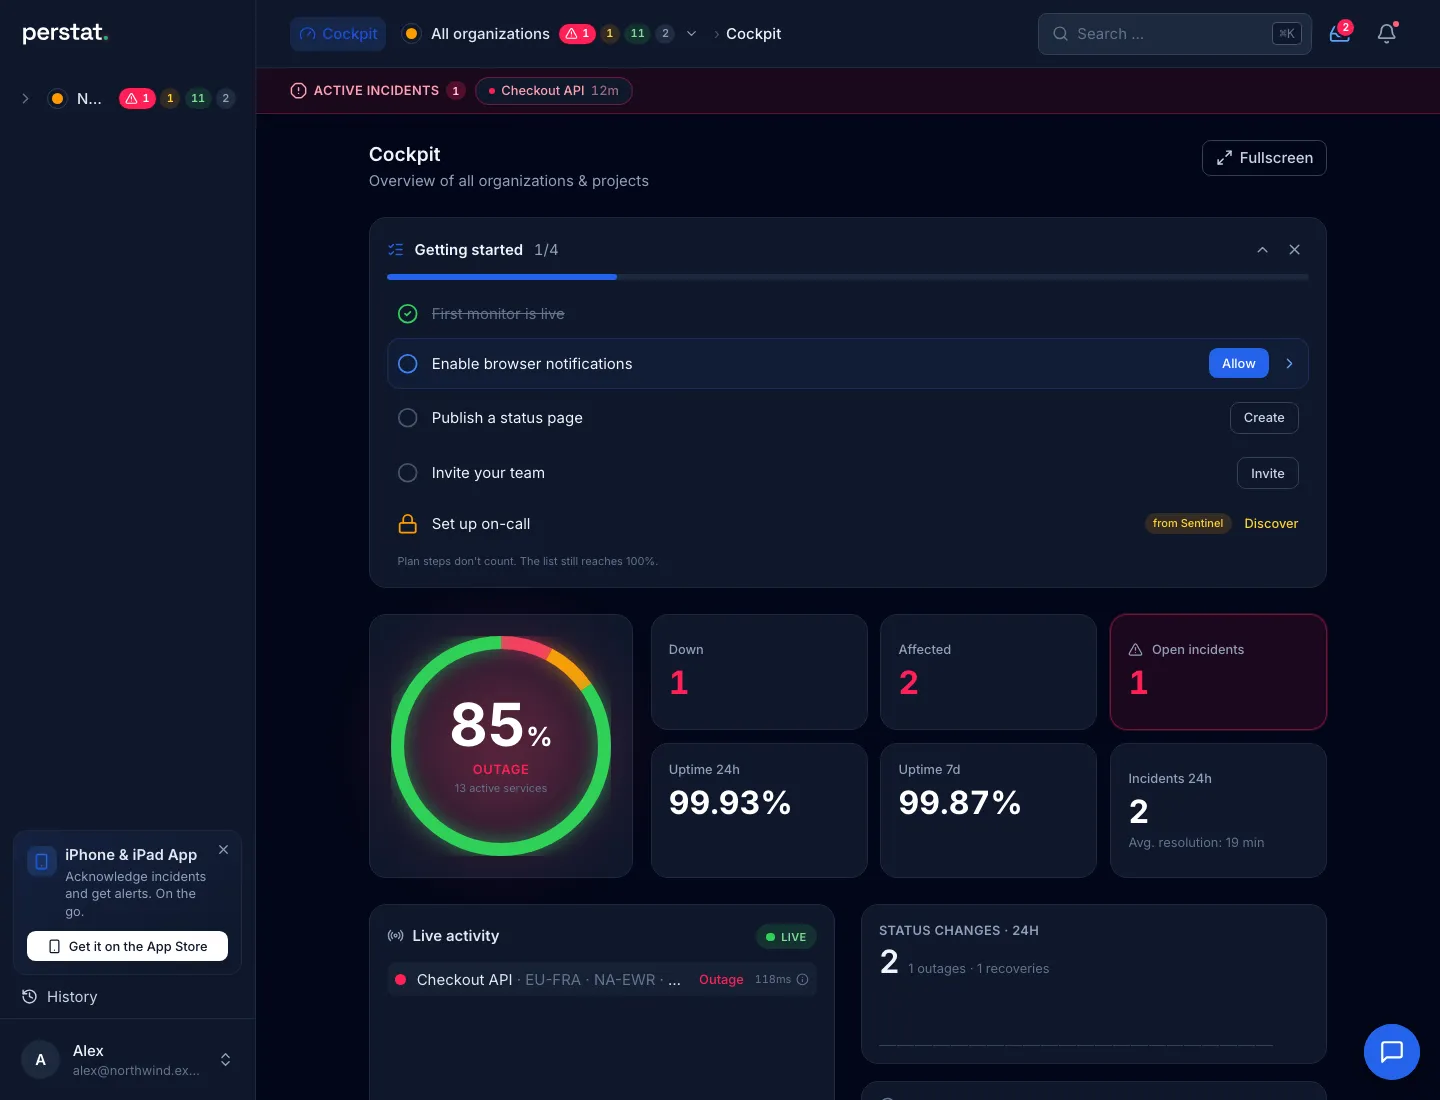
The screenshot shows a demo organization with fixed data, so it matches the descriptions below. Your numbers will differ, and the layout stays the same.
The incident banner
Section titled “The incident banner”An active incident places a banner above everything else, naming the service and how long it has been open. It is the only element that appears unprompted, so a cockpit without a banner means nothing is confirmed broken.
The banner stays after an acknowledgment, because acknowledging stops the escalation while the outage continues. From measurement to alarm explains the difference.
The ring and the counters
Section titled “The ring and the counters”The ring shows the share of services that are healthy, with the remainder split into degraded and down. The label underneath names the worst state present. A mostly green ring can therefore carry the label outage: one service being down is a fact about your product, not an average.
Around it:
| Counter | What it counts |
|---|---|
| Down | services with a confirmed outage right now |
| Affected | services not fully healthy, including degraded ones |
| Open incidents | unresolved incidents, acknowledged or not |
| Uptime 24 h / 7 days | share of passed checks over that window |
| Incidents 24 h | incidents opened in the last day, with the average time to resolve |
Uptime here is the raw share of passed checks. The availability figure in an SLA report goes further: it applies exclusion windows and maintenance, and it is floored rather than rounded. Evidence and retention explains that defensible number.
Live activity
Section titled “Live activity”The feed is a stream of individual check results as they arrive, with region and latency. It is the one place in the product that shows unconfirmed, single-region results.
Read it as the mechanism at work: a failing line here is one region’s signal, before any confirmation. Whether it becomes an incident depends on the quorum. The feed lets you watch the checks run, and the quorum decides when to wake somebody.
The pill in the corner shows whether the stream is connected. While it is disconnected, the rest of the cockpit stays correct and pauses its automatic updates.
Recent status changes
Section titled “Recent status changes”Confirmed transitions, newest first: which service, from which state to which, and when. This list and the 24-hour counter above it come from the same events, so they always agree.
Each change reads like healthy → outage or degraded → healthy. These are confirmed states rather than individual check results, which is what separates this panel from the live feed.
Getting started checklist
Section titled “Getting started checklist”New organizations see a short checklist. Steps that belong to a higher plan are marked and do not count toward completion, so the list reaches 100 % without a purchase.
- How monitoring works: the machinery behind these numbers.
- From measurement to alarm: what happens when something breaks.
- Reading a status page: what your customers see.