Monitors and check types
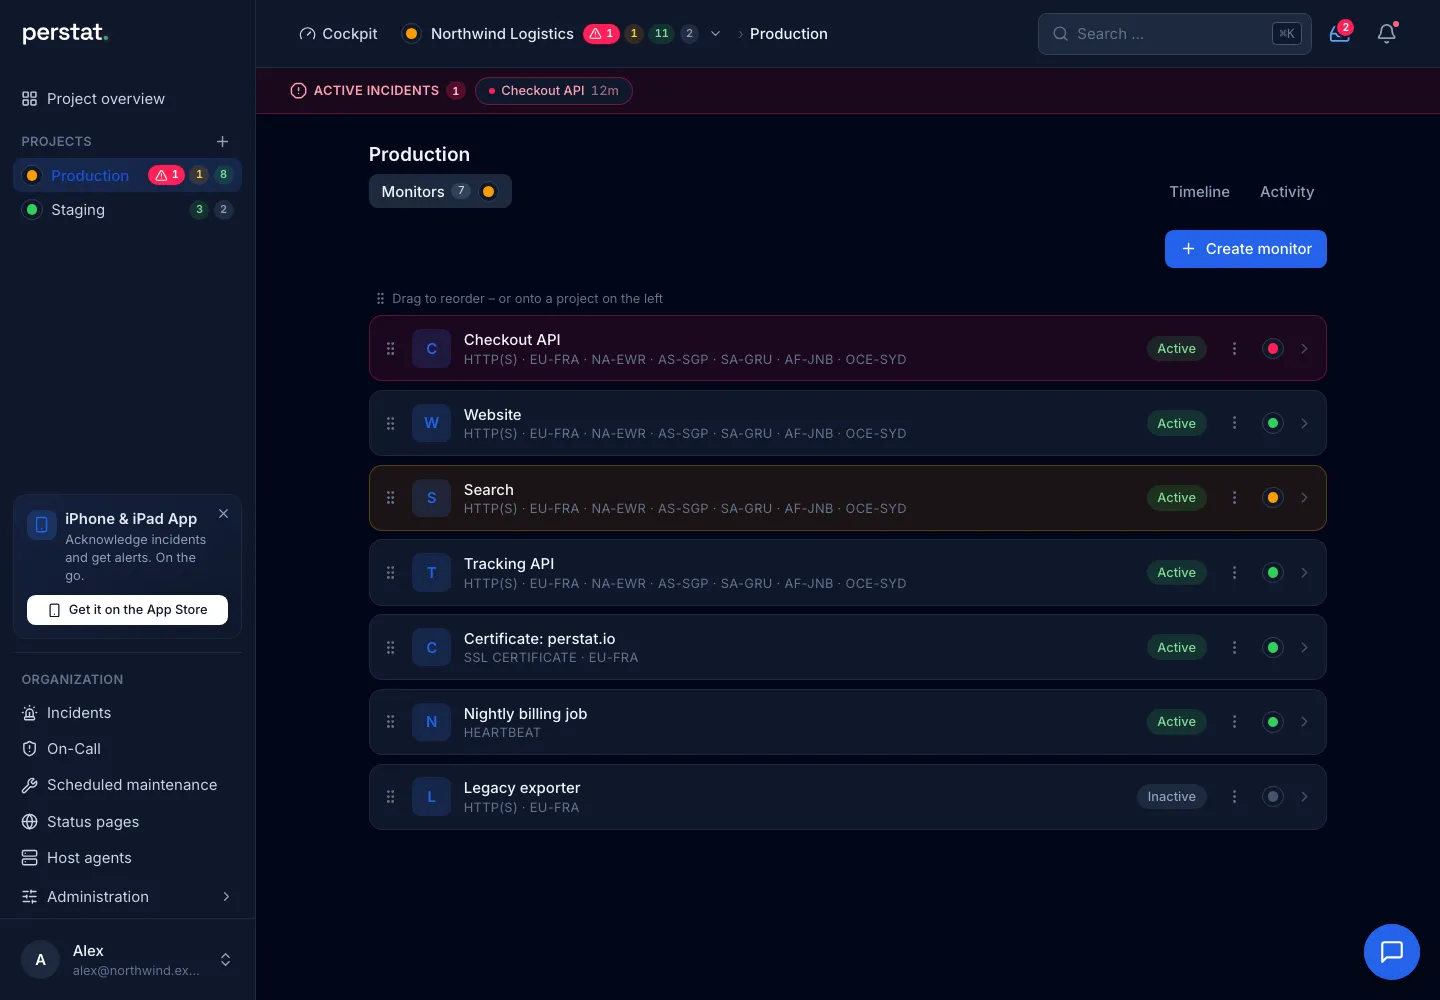
Jede Zeile ist ein Dienst: Name, Typ, die Regionen, aus denen geprueft wird, und der zuletzt bestaetigte Zustand als Punkt. Der Schalter rechts trennt aktiv von pausiert; ein pausierter Monitor bleibt in der Liste und behaelt seine Geschichte, prueft aber nicht mehr.
Die Liste zeigt auch, dass ein Monitor nicht immer eine Adresse im Netz meint: ein Zertifikats-Monitor prueft aus einer Region, ein Heartbeat gar nicht von aussen, sondern wartet auf einen Ping.
The 13 types
Section titled “The 13 types”http, http_headers, tcp, dns, dns_hygiene, domain, ssl_cert, smtp,
imap, ping, traceroute, agent, and heartbeat. The check-type reference
explains each in plain language; this page covers the configuration details.
HTTP monitors
Section titled “HTTP monitors”- Assertions: expected status code, a keyword the body must contain, or a regular expression against the body.
- Inline subchecks: an http monitor carries TLS-certificate (expiry, issuer, self-signed detection), security-header, and DNS-hygiene subchecks, so one monitor covers what used to take four.
- Redirects: followed up to 5 hops; every hop is validated against SSRF targets (private ranges, link-local, metadata endpoints) before it is fetched.
Dual-stack behavior
Section titled “Dual-stack behavior”Checks run across all A and AAAA records with per-family and per-IP results. Whether an
IPv6-only failure counts as degraded or as failed is your call, per monitor. dns_ms is
reported apart from total latency.
DNS specifics
Section titled “DNS specifics”A dns monitor compares the answer set against your expectation, and can cross-reference
its answers against another monitor’s answer set; a divergence runs through the normal
incident pipeline. dns_hygiene checks SPF, DMARC, and CAA as configuration. domain
watches NS, SOA, DNSSEC, and WHOIS expiry.
Asking one specific nameserver. By default a dns monitor asks Perstat’s own
resolver, so it measures the zone as a whole, cache included. Set server (a name
like a.example-ns.net or an IP) and the check asks exactly that server directly,
with no cache in between. Only then does it show when a single nameserver of a group
fails or answers differently from its siblings, which a check against the zone can
never reveal. Combined with a cross-reference between two such monitors, a divergence
between two servers becomes an incident.
With anycast the question stays honest, but the answer is local: each check region
reaches the node closest to it, so several regions cover several physical nodes of the
same address. The address actually reached is recorded with the result. Which node
answered can only be told apart if the server reports NSID or id.server.
Intervals
Section titled “Intervals”Intervals are configured per monitor; the floor depends on the plan: Free 300 s, Pulse 60 s, Sentinel 30 s, Command 15 s, Enterprise 10 s. Full limit tables live on plans and limits.
Agent monitors
Section titled “Agent monitors”The agent type binds a monitor to a host agent: availability with
a grace period, CPU, memory, and disk against thresholds, and named services with
anti-flapping grace. Missing data counts as pending, never as a false alarm; a silent
agent counts as down.
Heartbeat monitors
Section titled “Heartbeat monitors”The heartbeat type inverts the direction: instead of us calling your service, your job
calls us. It is the right type for a cron run, a batch import, a backup, anything with no
address to probe.
Each heartbeat has two endpoints, and your job decides which one to call:
https://api.perstat.io/ping/<token> # finished cleanlyhttps://api.perstat.io/ping/<token>/fail # ran, but something is wrongBoth accept GET or POST, so curl in a shell script is enough. The exact URL for a
monitor is on its detail page in the app and through the API. You wire it into the job
after creating the monitor, which is a step worth doing straight away: a heartbeat nobody
calls looks like coverage without being coverage.
Two settings decide when it breaches. period_seconds is how often you expect the job to
report, from 30 seconds up to 30 days. grace_seconds is the tolerance on top, so a
backup that occasionally runs long does not page anyone. Set the grace to a real fraction
of the period rather than to a token minute.
- Silence past the period plus the grace breaches.
- A call to the failure endpoint breaches at the next evaluation, within about half a minute, instead of waiting the period out.
A heartbeat stays unknown until its first ping arrives. That is deliberate: a schedule you have not confirmed yet cannot be violated.
Reporting a condition your job evaluates
Section titled “Reporting a condition your job evaluates”Because your side chooses the endpoint, a heartbeat can carry any condition a script can decide, not just “the job ran”. A timer that checks a queue depth, a record count or the size of a directory, and then calls the matching endpoint, turns a local measurement into an incident:
if [ "$(records)" -ge 1000 ]; then curl -fsS -m 10 "https://api.perstat.io/ping/$TOKEN" >/dev/nullelse curl -fsS -m 10 "https://api.perstat.io/ping/$TOKEN/fail" >/dev/nullfiThat covers what a threshold on a host metric cannot express, such as a count that dropped below where it should be. One heartbeat carries one condition, so give distinct assertions distinct monitors rather than folding them into a single ping.