Reading a status page
This page is for the people who read a status page rather than run one: your customers, your support team, an auditor checking a claim. If you are setting one up, see Status pages.
Every screenshot here is our own status page. It is public, so you can compare what you read here against the live page at any time.
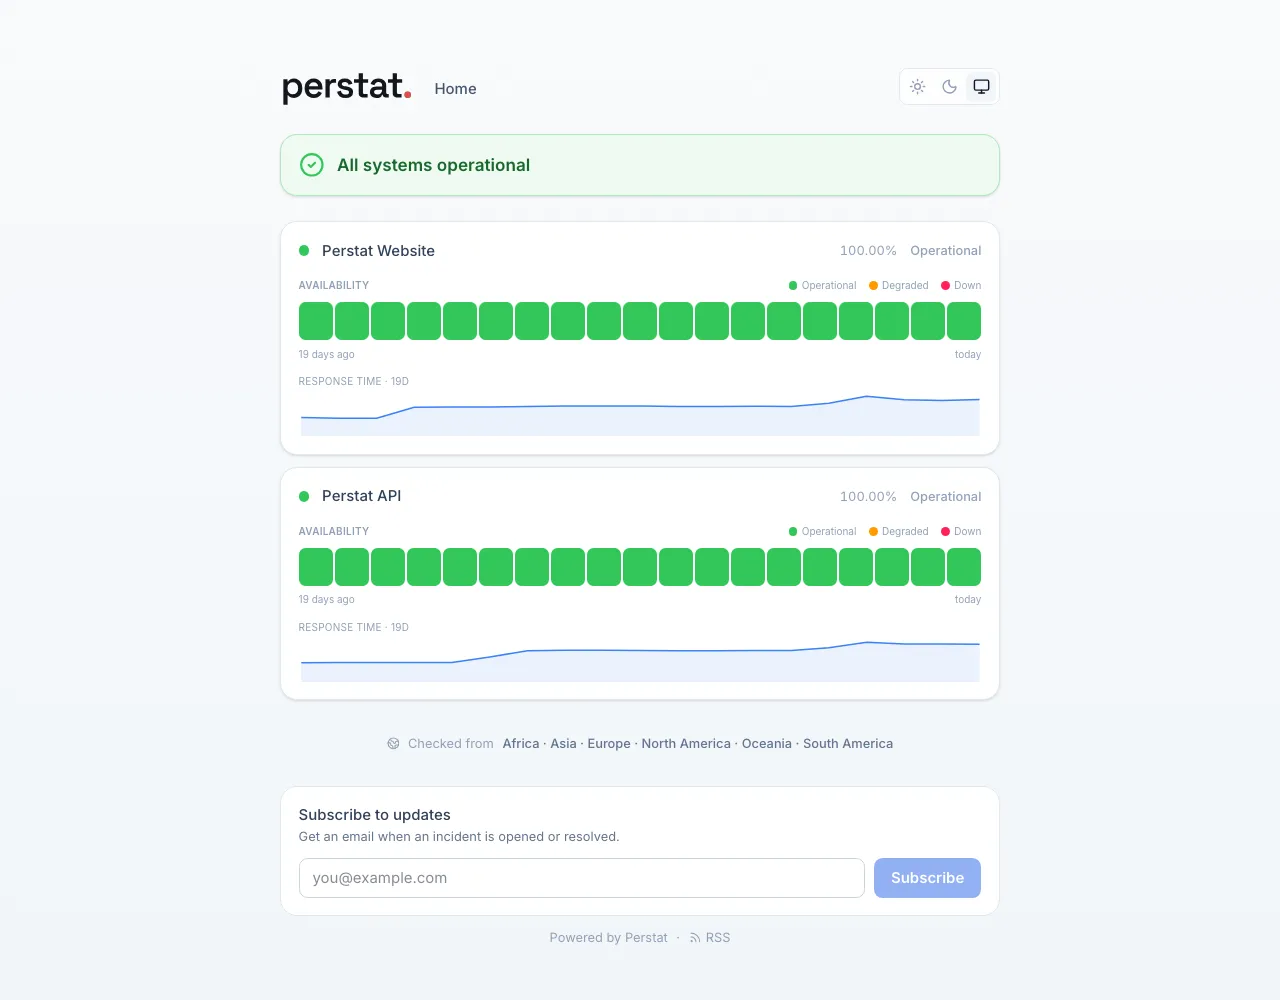
The banner
Section titled “The banner”The top line is the whole page in one sentence - All systems operational, or the most severe state among the components below it. It is derived, never typed by hand: nobody sets a status page to green.
A component
Section titled “A component”Each component is one monitored service. It carries three things:
The state dot and label - operational, degraded, or down. This is the quorum-confirmed state, not one probe’s opinion. A single region seeing a failure does not colour this dot; see Quorum and regions.
The availability bar - one segment per day, up to 90 days here. Green is a day without confirmed downtime, and the percentage to the right is the availability over that window. Two things it deliberately does not do:
- It does not round up. The figure is a lower bound you can rely on.
- It does not count a day it has no data for as good. A day without checks is a gap, not a green segment.
- It does not claim a longer history than it has. A page published two weeks ago is labelled “14 days ago”, not “90 days ago” - the label always names the span actually drawn.
The response time chart - the latency over the same window. Useful for the question a bar chart cannot answer: was it slow before it broke?
Where it was measured from
Section titled “Where it was measured from”Checked from Africa · Asia · Europe · North America · Oceania · South America
Six regions, one per inhabited continent. This line matters more than it looks: availability measured from one place is a statement about one network path. A service that is up in Frankfurt and unreachable from São Paulo is not “up”, and a page that measured from Frankfurt only would never tell you.
The regions available depend on the operator’s plan - see Plans and limits.
Subscribing
Section titled “Subscribing”The subscribe box sends an email when an incident is opened and when it is resolved. It is double opt-in: you get a confirmation mail first, and nothing arrives until you follow that link. Every message afterwards carries a one-click unsubscribe.
If you would rather not hand over an address, the page also offers an RSS feed - same events, no email.
On a phone
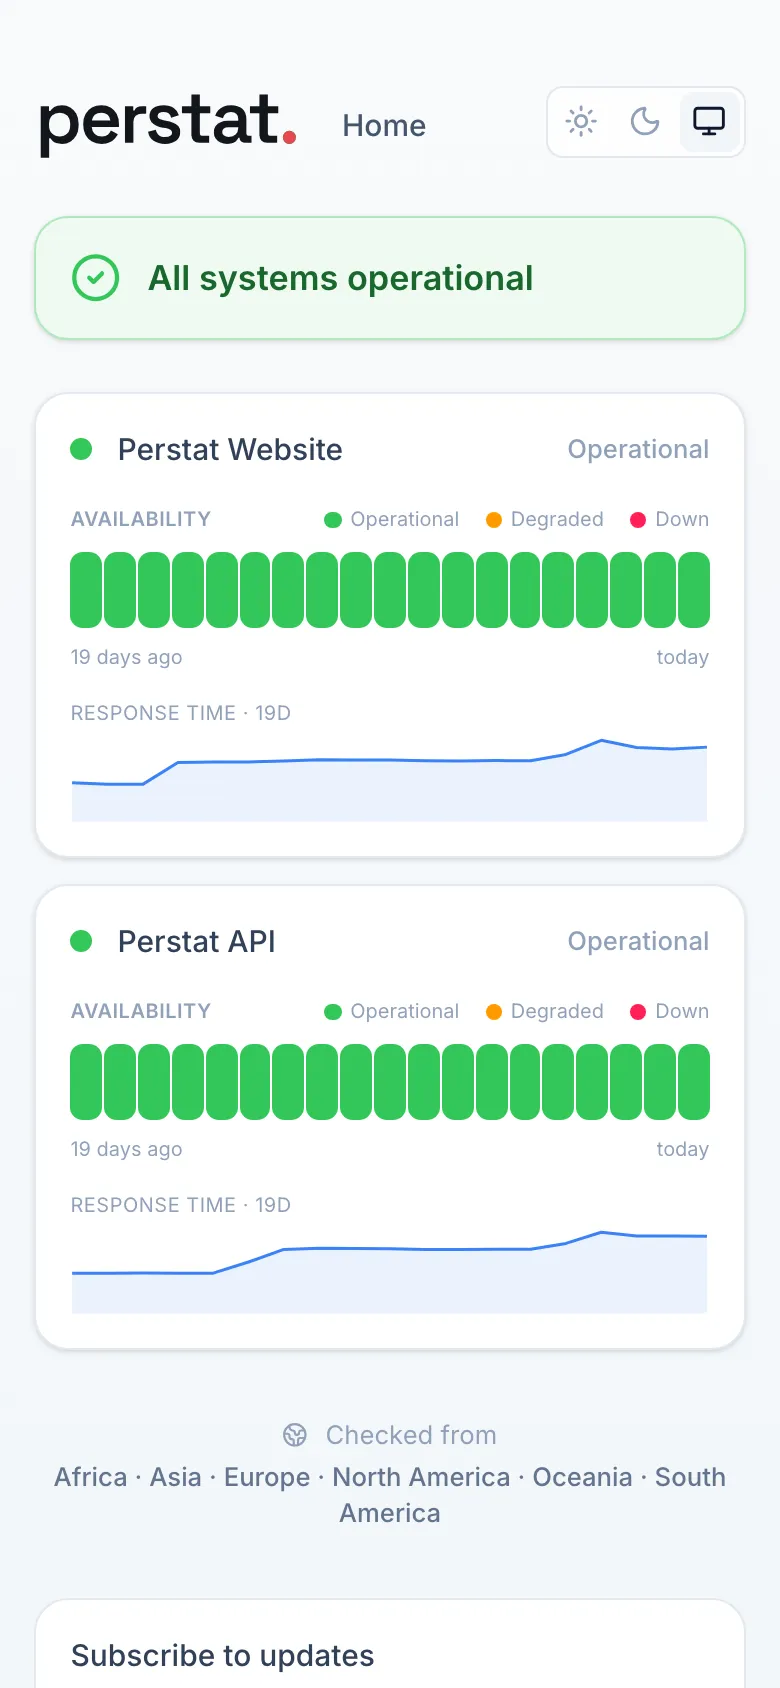
Section titled “On a phone”The page reflows to a single column, and the availability strip keeps every day it has rather than quietly dropping days to fit. A narrow screen shows thinner bars, never a shorter history.
What the page will not tell you
Section titled “What the page will not tell you”- It is not a live probe. It shows confirmed state at check interval resolution, not “right this second”.
- It does not show every blip. Failures below the alarm quorum stay off the page on purpose - that is the difference between a status page and a noise feed.
- Maintenance is labelled as maintenance, not folded into downtime, and it appears as a banner while it runs.
The line at the bottom
Section titled “The line at the bottom”Powered by Perstat links to perstat.io on pages without white-label. From Command,
the operator can remove that mark and show only its own light- and dark-mode branding;
see Status pages.